

Data is the new currency of business success, but raw data is virtually worthless without the ability to extract meaningful insights and make informed decisions. While businesses generate more data than ever before – from customer interactions and sales transactions to operational metrics and market trends – most organizations struggle to transform this information into actionable intelligence that drives growth and competitive advantage.
AI-powered data visualization tools have emerged as the solution, using artificial intelligence to automatically analyze complex datasets, identify hidden patterns, and present insights through intuitive visual representations that enable instant decision-making. These tools don’t just create charts and graphs – they reveal the story your data is telling and highlight the specific actions you should take to improve your business performance.
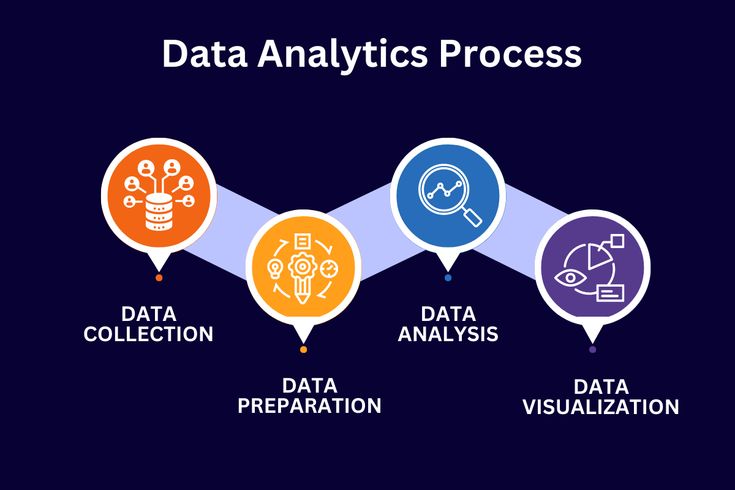
The Data Visualization Revolution: From Information Overload to Insight Generation
Traditional data analysis approaches – manual spreadsheet manipulation, static reports, and basic charting tools – are no longer sufficient for modern business decision-making. Today’s successful businesses need AI-enhanced visualization tools that can process vast amounts of information and automatically surface the insights that matter most.
The compelling statistics driving AI data visualization adoption:
- Businesses using AI data visualization make decisions 23% faster than those relying on traditional analysis
- Companies with data-driven decision making are 19 times more likely to be profitable
- AI-powered insights improve business performance by an average of 32%
- Organizations using advanced data visualization see 28% improvement in identifying new business opportunities
- 83% of executives report that AI data visualization has changed how they make strategic decisions
But the real transformation comes from AI’s ability to automatically identify correlations, predict trends, and recommend specific actions based on data patterns that human analysts might miss or take weeks to uncover.
Understanding AI-Enhanced Data Visualization Technology

Beyond Static Charts: Intelligent Data Analysis
Traditional Data Visualization:
- Manual data preparation and cleaning
- Static charts and graphs requiring interpretation
- Limited ability to analyze large datasets
- Time-consuming creation of reports and dashboards
- Reactive analysis of historical information
AI-Powered Data Visualization:
- Automated data processing and pattern recognition
- Interactive, intelligent visualizations that adapt based on user needs
- Real-time analysis of streaming data from multiple sources
- Predictive visualizations that forecast future trends
- Proactive identification of anomalies and opportunities
Key AI Technologies Transforming Data Visualization
Machine Learning Pattern Recognition: Automatically identifies trends, correlations, and anomalies in data that might not be obvious through traditional analysis methods.
Natural Language Processing: Enables users to ask questions about their data in plain English and receive visual answers and insights.
Predictive Analytics Integration: Combines historical data analysis with forecasting to show not just what happened, but what’s likely to happen next.
Automated Insight Generation: AI systems that automatically generate written explanations of what visualizations reveal and recommend specific actions.
Real-Time Data Processing: Capability to visualize and analyze streaming data for immediate decision-making and rapid response to changing conditions.
Real-World AI Data Visualization Success Stories
Medical Practice Performance Optimization
Dr. Robert Kim’s multi-physician practice was struggling to understand why some locations were significantly more profitable than others, despite serving similar patient populations. Traditional financial reports provided basic revenue information but didn’t reveal the underlying factors driving performance differences.
Data Analysis Challenges:
- Multiple Data Sources: Patient management systems, billing software, scheduling systems, and financial records
- Complex Variables: Provider productivity, patient satisfaction, appointment efficiency, and revenue per patient
- Hidden Correlations: Unclear relationships between operational metrics and financial performance
- Timing Issues: Difficulty identifying trends and seasonal patterns across multiple years of data
AI Data Visualization Implementation: The practice implemented AI-powered visualization tools that automatically integrated data from all systems and revealed insights through interactive dashboards:
- Revenue Performance Analysis: AI identified that practices with shorter average wait times had 34% higher patient satisfaction and 28% higher revenue per patient
- Provider Productivity Insights: Visualization revealed that certain appointment types were significantly more profitable and identified optimization opportunities
- Patient Flow Optimization: AI analysis showed how scheduling patterns affected both patient satisfaction and practice profitability
- Predictive Revenue Modeling: Forecasting tools that predicted monthly revenue based on scheduling patterns and historical data
Business Transformation Results:
- Practice revenue increased by 42% through optimization of high-value appointment types and scheduling efficiency
- Patient satisfaction improved by 38% through data-driven wait time and service quality improvements
- Operational efficiency increased by 51% through AI-recommended scheduling and workflow optimizations
- Decision-making speed improved by 67% through real-time dashboard access to key performance metrics
Multi-Location Retail Business Intelligence
“Home Comfort Solutions,” a regional home goods retailer with eight locations, was struggling to understand why some stores significantly outperformed others and how to optimize inventory, staffing, and marketing across all locations.
Complex Multi-Location Challenges:
- Inconsistent Performance: Store revenues varying by 200% despite similar market conditions
- Inventory Optimization: Difficulty determining optimal product mix for each location
- Staffing Efficiency: Unclear correlation between staffing levels and sales performance
- Marketing ROI: Limited understanding of which marketing efforts drove actual sales
Comprehensive AI Visualization Solution: Implementation of integrated AI data visualization tools that combined sales data, customer behavior, inventory information, and external market data:
- Store Performance Analysis: AI identified that stores with certain product category focuses had dramatically higher profit margins
- Customer Behavior Insights: Visualization revealed shopping patterns and preferences that varied significantly by location and season
- Inventory Optimization: AI analysis showed which products had the highest turnover and profit potential for each specific location
- Marketing Attribution: Clear visualization of marketing channel effectiveness and ROI by location and customer segment
Business Impact:
- Overall revenue growth of 56% through AI-optimized product mix and inventory management
- Profit margin improvement of 34% by focusing on high-margin products identified through AI analysis
- Inventory costs reduced by 28% through predictive stocking based on AI demand forecasting
- Marketing ROI improved by 89% through data-driven channel optimization and targeting
Get Your Custom AI Phone Agent – Built For Your Business FREE

Ready to begin leveraging AI for business insights? Start with an AI phone system that not only improves customer service but also collects valuable interaction data that can drive business decisions.
Why AI Phone Data Is Incredibly Valuable:
Rich Customer Insights:
- Real Customer Concerns: Understand what customers actually call about most frequently
- Service Quality Metrics: Track response times, resolution rates, and satisfaction patterns
- Sales Opportunity Identification: Discover which inquiries lead to the highest conversion rates
- Operational Optimization: Identify peak call times and staffing optimization opportunities
Why Responsive Communication Matters:
90% of buyers demand a response within 10 minutes (HubSpot research)
55% will abandon a business if they can’t get a quick answer (Forrester)
73% will ditch brands after slow or poor service (Convin.ai)
82% rate ‘speed of response’ as a top factor in choosing businesses
What You’ll Receive – Completely FREE:
- ✓ Custom-Built AI Phone Agent – Trained specifically on your business information, services, and FAQs
- ✓ Dedicated Phone Number – Test your custom AI agent with a real phone number you can call anytime
- ✓ Personalized Greeting – Your AI answers with your business name and customized welcome message
- ✓ FAQ Knowledge Base – Your AI agent comes pre-loaded with answers to common questions about your business
- ✓ Appointment Scheduling Capability – Let callers schedule time with you (if desired)
- ✓ Message Forwarding – Get notified about important calls and requests
- ✓ Call Transcripts – Review conversations to see how your AI handles inquiries
- ✓ One-on-One Consultation – Get personalized advice on how to best implement AI in your business
How It Works – Ready in Less Than 24 Hours!
1. Submit Your Information – Fill out the simple form with your business details and website
2. We Build Your AI Agent – Our team creates a custom AI tailored to your business needs
3. Receive Your Test Number – Get a text with your dedicated phone number to try your AI
4. Test & Provide Feedback – Try out your AI and let us know what you think
No Credit Card Required • Custom Built For Your Business • Live Test Number Included
Comprehensive Guide to AI Data Visualization Tools
Enterprise-Grade AI Visualization Platforms
Tableau with AI Integration
Best For: Large organizations with complex data analysis needs and dedicated analytics teams
AI-Enhanced Features:
- Ask Data: Natural language querying that allows users to ask questions about data in plain English
- Explain Data: Automated insights that explain unusual patterns and outliers in visualizations
- Einstein Discovery: Predictive analytics integration that forecasts trends and identifies key drivers
- Automated Dashboard Creation: AI that suggests optimal visualization types based on data characteristics
Key Capabilities:
- Advanced statistical analysis with machine learning integration
- Real-time data connection to hundreds of data sources
- Collaborative analytics with enterprise security features
- Mobile-optimized dashboards for on-the-go decision making
Investment Range: $70-$150+ per user per month depending on features and deployment
Microsoft Power BI with AI
Best For: Organizations using Microsoft ecosystem with need for integrated business intelligence
AI-Powered Features:
- Q&A Visual: Natural language question answering about data
- Smart Narratives: Automated generation of insights and explanations for visualizations
- Anomaly Detection: AI identification of unusual patterns requiring attention
- Forecasting: Built-in predictive analytics for trend projection
Integration Advantages:
- Seamless integration with Microsoft Office and Azure cloud services
- AI capabilities powered by Microsoft’s cognitive services
- Advanced security and compliance features for enterprise deployment
- Cost-effective licensing for organizations already using Microsoft products
Investment Range: $10-$20 per user per month for basic features, enterprise pricing varies
Qlik Sense with Augmented Analytics
Best For: Businesses requiring associative data analysis and self-service analytics
AI-Enhanced Capabilities:
- Augmented Analytics: Automated insights generation and data preparation
- Cognitive Engine: AI that suggests relevant visualizations and analyses
- Advanced Analytics Integration: Built-in machine learning and statistical analysis
- Natural Language Generation: Automated narrative insights from data patterns
Unique Features:
- Associative model that reveals hidden relationships in data
- Self-service analytics capabilities for non-technical users
- Mobile-first design for modern business intelligence needs
- Advanced data governance and security features
Investment Range: $30-$70+ per user per month based on features and deployment model
Specialized AI Data Visualization Solutions
Sisense AI-Driven Analytics
Best For: Mid-market businesses needing to analyze complex data from multiple sources
AI-Powered Features:
- Automated Data Preparation: AI that cleans and structures data automatically
- Smart Recommendations: Suggested visualizations and analyses based on data characteristics
- Natural Language Processing: Conversational analytics and automated insight generation
- Anomaly Detection: Proactive identification of unusual patterns and outliers
Business Focus:
- Designed for business users rather than technical analysts
- Simplified data integration from multiple sources
- Embedded analytics capabilities for customer-facing applications
- Industry-specific templates and best practices
Looker (Google Cloud)
Best For: Technology-forward companies requiring scalable, cloud-native analytics
AI Integration:
- BigQuery ML Integration: Machine learning directly within data analysis workflows
- Smart Analytics: Automated insights and pattern recognition
- Natural Language Queries: Plain English questions about business data
- Predictive Modeling: Built-in forecasting and trend analysis capabilities
Technical Advantages:
- Modern, API-first architecture for integration flexibility
- Git-based version control for analytics development
- Real-time data analysis capabilities
- Advanced security and governance features
Industry-Specific AI Visualization Tools
Healthcare Analytics Platforms
Epic Cogito and Similar Solutions:
- Clinical Decision Support: AI-powered visualizations for patient care optimization
- Population Health Management: Pattern recognition for community health trends
- Operational Efficiency: AI analysis of hospital and clinic operational data
- Compliance Monitoring: Automated visualization of regulatory compliance metrics
Financial Services Analytics
SAS Visual Analytics and Similar Platforms:
- Risk Management Visualization: AI-powered risk assessment and monitoring dashboards
- Fraud Detection: Real-time visualization of suspicious transaction patterns
- Customer Analytics: AI insights into customer behavior and lifetime value
- Regulatory Reporting: Automated compliance dashboard generation
Retail and E-commerce Intelligence
Adobe Analytics with AI and Similar Tools:
- Customer Journey Visualization: AI mapping of customer interaction patterns
- Inventory Optimization: Predictive analytics for stock management
- Price Optimization: AI-driven pricing strategy visualization
- Marketing Attribution: Clear visualization of marketing channel effectiveness
Implementation Strategy for AI Data Visualization
Phase 1: Data Assessment and Preparation
Current Data Audit:
- Data Source Identification: Catalog all systems containing business-relevant data
- Data Quality Assessment: Evaluate accuracy, completeness, and consistency of existing data
- Integration Requirements: Determine how to connect disparate data sources
- Security and Compliance: Assess data privacy and regulatory requirements
Business Objective Definition:
- Key Performance Indicators: Identify metrics most critical for business decisions
- Decision-Making Processes: Understand how data insights will be used
- User Requirements: Determine who needs access to what types of information
- Success Criteria: Define measurable outcomes for data visualization implementation
Phase 2: Platform Selection and Architecture Design
Tool Evaluation Criteria:
- Ease of Use: User-friendliness for both technical and non-technical staff
- AI Capabilities: Quality and relevance of automated insights and recommendations
- Integration Options: Ability to connect with existing business systems
- Scalability: Capacity to grow with business needs and data volumes
- Total Cost of Ownership: Including licensing, implementation, and ongoing maintenance
Architecture Planning:
- Data Pipeline Design: How data flows from sources to visualization platform
- Security Implementation: Access controls, encryption, and compliance measures
- Performance Optimization: Ensuring fast query response and visualization loading
- Backup and Recovery: Data protection and business continuity planning
Phase 3: Implementation and Training
Technical Deployment:
- Data Connection Setup: Establishing secure, reliable connections to data sources
- Dashboard Development: Creating initial visualizations and reports based on business needs
- Performance Testing: Ensuring system responsiveness under expected usage loads
- Security Validation: Confirming appropriate access controls and data protection
User Training and Adoption:
- Executive Dashboard Training: High-level overview training for leadership decision-making
- Department-Specific Training: Customized training for different business functions
- Self-Service Analytics: Training power users to create their own visualizations
- Change Management: Helping organization adapt to data-driven decision making
Phase 4: Optimization and Expansion
Performance Monitoring:
- Usage Analytics: Understanding which dashboards and insights are most valuable
- Performance Metrics: Tracking system response times and user satisfaction
- Business Impact Measurement: Quantifying improvements in decision-making and outcomes
- ROI Assessment: Calculating return on investment from data visualization implementation
Continuous Improvement:
- New Data Source Integration: Adding additional data sources as business needs evolve
- Advanced AI Features: Implementing more sophisticated machine learning and prediction capabilities
- User Feedback Integration: Refining visualizations based on user needs and preferences
- Expansion Planning: Scaling successful implementations to additional business areas
Advanced AI Data Visualization Strategies
Predictive Visualization and Forecasting
Trend Analysis and Projection:
- Sales Forecasting: AI-powered predictions of future revenue based on historical patterns and market conditions
- Customer Behavior Prediction: Visualization of likely customer actions and preferences
- Operational Forecasting: Predictions of resource needs, capacity requirements, and operational challenges
- Market Trend Analysis: AI identification of emerging market opportunities and threats
Scenario Planning and What-If Analysis:
- Business Impact Modeling: Visualization of potential outcomes from different strategic decisions
- Risk Assessment: AI-powered visualization of potential risks and their likelihood
- Resource Allocation Optimization: Visual analysis of optimal resource distribution scenarios
- Strategic Planning Support: Data visualization tools that support long-term business planning
Real-Time Operational Intelligence
Live Dashboard Implementation:
- Operational Monitoring: Real-time visualization of key business processes and performance metrics
- Alert Systems: AI-powered notifications when metrics exceed acceptable ranges
- Performance Optimization: Continuous monitoring and optimization recommendations
- Customer Experience Tracking: Real-time visualization of customer satisfaction and service quality
Crisis Management and Response:
- Anomaly Detection: Immediate identification of unusual patterns requiring attention
- Root Cause Analysis: AI-powered investigation of problems and their underlying causes
- Response Coordination: Visualization tools that support rapid response to business challenges
- Recovery Tracking: Monitoring and visualization of business recovery efforts
Measuring AI Data Visualization Success
Business Impact Metrics
Decision-Making Improvement:
- Decision Speed: Reduction in time required to make informed business decisions
- Decision Quality: Improvement in outcomes from data-driven decisions
- Strategic Alignment: Better alignment between data insights and business strategy
- Competitive Advantage: Measurable improvements in market position due to better insights
Operational Efficiency:
- Process Optimization: Improvements in business processes identified through data analysis
- Resource Utilization: Better allocation of staff, inventory, and financial resources
- Cost Reduction: Decreased expenses through data-driven optimization
- Revenue Enhancement: Increased income through better understanding of business drivers
User Adoption and Satisfaction
Usage Metrics:
- Dashboard Utilization: Frequency and depth of data visualization tool usage
- Self-Service Analytics: Number of users creating their own reports and analyses
- Mobile Usage: Adoption of mobile data visualization for on-the-go decision making
- Cross-Department Adoption: Spread of data-driven decision making across organization
Quality Measures:
- User Satisfaction: Feedback on usefulness and ease of use of visualization tools
- Training Effectiveness: Success rate of user training and onboarding programs
- Support Requirements: Level of ongoing support needed for successful tool utilization
- Innovation Metrics: New insights and discoveries generated through data visualization
Common Implementation Challenges and Solutions
Challenge 1: Data Quality and Integration Issues
Solution: Invest in data cleaning and preparation before visualization implementation. Use AI-powered data preparation tools to automate much of the data quality improvement process.
Challenge 2: User Adoption Resistance
Solution: Focus on demonstrating immediate value through quick wins. Provide comprehensive training and ensure visualization tools directly support users’ daily decision-making needs.
Challenge 3: Over-Complexity in Visualization Design
Solution: Start with simple, focused dashboards that answer specific business questions. Gradually add complexity as users become more comfortable with data-driven decision making.
Challenge 4: Inadequate Performance and Scalability
Solution: Plan for growth from the beginning. Choose platforms that can scale with business needs and implement proper data architecture to support increasing data volumes.
The Future of AI Data Visualization

Emerging Technologies and Capabilities
Advanced AI Integration:
- Conversational Analytics: Natural language interaction with data through voice and chat interfaces
- Augmented Reality Visualization: 3D and immersive data visualization experiences
- Automated Storytelling: AI that creates compelling narratives from data insights
- Personalized Insights: AI that learns individual user preferences and provides customized analysis
Enhanced Predictive Capabilities:
- Real-Time Machine Learning: AI models that continuously learn and improve from new data
- Multi-Source Prediction: AI that combines internal business data with external market intelligence
- Automated Optimization: Systems that automatically adjust business processes based on data insights
- Prescriptive Analytics: AI that not only predicts what will happen but recommends specific actions
Industry Evolution and Specialization
Healthcare Data Visualization: Advanced patient outcome prediction, population health management, and clinical decision support through AI-powered medical data visualization.
Financial Services Intelligence: Real-time risk assessment, automated compliance monitoring, and personalized financial product recommendations through sophisticated financial data AI.
Retail and E-commerce Analytics: Customer behavior prediction, inventory optimization, and personalized shopping experience creation through advanced retail data intelligence.
Manufacturing and Supply Chain: Predictive maintenance, supply chain optimization, and quality control through AI-powered operational data visualization.
Your AI Data Visualization Implementation Checklist
Immediate Actions (This Week)
- Audit current data sources and identify most valuable business intelligence opportunities
- Define key business questions that data visualization should answer
- Research AI data visualization platforms suitable for your business size and needs
- Assess current data quality and integration requirements
Short-Term Goals (Next Month)
- Select AI data visualization platform and begin implementation planning
- Design initial dashboards focusing on highest-impact business metrics
- Plan user training and change management strategy
- Establish success metrics and ROI measurement criteria
Medium-Term Objectives (Next Quarter)
- Complete initial data visualization implementation and user training
- Launch pilot dashboards with key stakeholders and gather feedback
- Optimize performance and refine visualizations based on usage patterns
- Plan expansion to additional data sources and business areas
Long-Term Vision (Next Year)
- Achieve organization-wide adoption of data-driven decision making
- Implement advanced AI features like predictive analytics and automated insights
- Measure and document ROI from improved decision-making capabilities
- Develop competitive advantage through superior business intelligence capabilities
The businesses that will lead their industries are those that can transform raw data into actionable intelligence faster and more accurately than their competitors. AI data visualization tools don’t just make data prettier – they make data powerful by revealing insights that drive better decisions, improved operations, and sustainable competitive advantage.
Ready to Transform Your Customer Experience?

Get Your Custom AI Phone Agent – Built For Your Business FREE
Data without insights is just digital clutter. Don’t let valuable business intelligence remain hidden in your systems while competitors gain advantage through better decision-making.
Never miss another call while delivering exceptional customer experiences. We’ll build your personalized AI phone agent at no cost – just tell us about your business.
Let Your Team Focus on What Matters Most
While your AI phone agent handles routine customer interactions, your team can focus on high-value activities. Our voice AI agents efficiently manage high call volumes, giving your staff more time for complex customer experience challenges.
Comprehensive Communication Solution
Your custom AI phone agent supports multiple languages and handles both inbound and outbound calls, ensuring no customer inquiry goes unanswered. The system creates support tickets automatically, streamlining your customer service operations.
What You’ll Receive – Completely FREE:
- ✓ Custom-Built AI Phone Agent – Trained specifically on your business information, services, and FAQs
- ✓ Dedicated Phone Number – Test your custom AI agent with a real phone number you can call anytime
- ✓ Personalized Greeting – Your AI answers with your business name and customized welcome message
- ✓ FAQ Knowledge Base – Your AI agent comes pre-loaded with answers to common questions about your business
- ✓ Appointment Scheduling Capability – Let callers schedule time with you (if desired)
- ✓ Message Forwarding – Get notified about important calls and requests
- ✓ Call Transcripts – Review conversations to see how your AI handles inquiries
- ✓ One-on-One Consultation – Get personalized advice on how to best implement AI in your business
How It Works – Ready in Less Than 24 Hours!
1. Submit Your Information – Fill out the simple form with your business details and website
2. We Build Your AI Agent – Our team creates a custom AI tailored to your business needs
3. Receive Your Test Number – Get a text with your dedicated phone number to try your AI
4. Test & Provide Feedback – Try out your AI and let us know what you think
No Credit Card Required • Custom Built For Your Business • Live Test Number Included
The future belongs to businesses that make decisions based on data, not guesswork. Start building your data intelligence capabilities today and transform your business through the power of AI-driven insights.